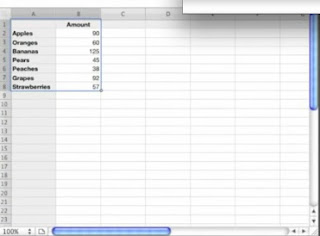
Learn how to create simple charts from spreadsheet data in iWork 09 Numbers. You can create pie charts and line graphs and then customize how they look with inspectors and by just dragging elements. You can also put the charts on a separate page for printing.
Posted and created by Gary Rosenzweig on 10/6/10


This spreadsheet is easy to include in your BLOG entries.
ReplyDelete